Articles
Breakdowns of individual indicators: what the figures show, how they are calculated and where to view the full series
-
Traffic Accidents by Russian Regions: Where It Is More Dangerous to Drive, Rosstat Data
2026-10-29
Road traffic accident mortality per 100 thousand residents: Kalmykia 36.7, Tuva 28.4, Moscow 2.6. Ranking of regions and districts, number of accidents and drunk drivers. Rosstat data.
-
Real incomes of the population by regions of Russia: where they rose and where they fell
2026-10-29
In 2025, real incomes grew in all 85 regions: from 101.4% in Murmansk Oblast to 110.6% in Zabaykalsky Krai. Rankings and dynamics since 2014. Rosstat.
-
Migration by regions of Russia: where people leave from and where they move to, Rosstat data
2026-10-28
Migration by regions of Russia in 2023: Yugra +12.1 per 1,000 inhabitants, Tuva −7.4. Flows between districts since 2000, villages and cities. Rosstat data.
-
Men's and Women's Salaries in Russia: How and Where They Differ
2026-10-28
Men earn 117,748 rubles, women 78,977: women's salary is 67% of men's. Differences by industry, age and occupations. Rosstat data.
-
Birth rates by Russian regions: where the most and fewest births occur, Rosstat data
2026-10-28
Birth rate by regions of Russia in 2023: Chechnya 20.0 per 1,000 residents, Smolensk Oblast 5.8. Districts, dynamics and data for 2025. Rosstat.
-
Births of boys and girls in Russia by year: how many are born and what is the sex ratio
2026-10-27
In 2022, 670,177 boys and 633,910 girls were born in Russia: 1,057 per 1,000. Sex ratio since 1960, urban and rural. Rosstat data.
-
Average pension by regions of Russia in 2026: where the most and where the least
2026-10-27
Average pension by regions: from 17,352 rubles in Dagestan to 38,659 in Chukotka. Ranking, federal districts, comparison with the subsistence minimum. Rosstat data.
-
Milk prices by year and in 2026: how much a litre cost then and how much it costs now
2026-10-26
A liter of milk in Russia costs 98.99 ₽ as of October 19, 2026. Prices by year since 1998, by week since 2022, kefir, cottage cheese, sour cream and butter. Data from Rosstat.
-
How many doctors are in the regions of Russia: coverage per 10,000 residents according to 2024 data
2026-10-26
Physician availability by Russian regions in 2024: from 31.8 per 10 thousand residents in Kurgan Oblast to 88.7 in St. Petersburg. Rating and charts based on Rosstat data.
-
Average salary in Novosibirsk in 2026: how much is paid and what most people receive
2026-10-26
Average salary in Novosibirsk Oblast for January–June 2026 was 93,157 ₽, for 2025 was 88,684 ₽. Median, net, comparison with Siberia and Russia.
-
Informal employment in Russia: how many people work outside registered companies
2026-10-25
In the informal sector of Russia, 15.1 million people work, representing 20.3% of all employed. Dynamics since 2015, industries, men and women, rural and urban.
-
How many years to save for an apartment: housing affordability in Russia according to Rosstat
2026-10-25
A 54 m² apartment costs 5.8 years of average salary. In Yugra 3.7 years, in Sevastopol 12.4. Dynamics since 2000, regions and what is not accounted for in the calculation.
-
Minimum subsistence level in Krasnoyarsk Krai in 2026: for an individual, a child and a pensioner
2026-10-25
Subsistence minimum in the Krasnoyarsk Krai for 2026: 21,022 ₽ per capita, 22,914 ₽ for working people, 20,391 ₽ per child. Family calculation, Rosstat data.
-
Bread Prices by Year and in 2026: How Much a Kilogram and a Loaf Cost
2026-10-24
A kilogram of wheat bread on 12 October 2026 costs 126.46 ₽, rye 107.73 ₽, up +10% for the year. Prices by weeks, years since 1998 and regions.
-
Where is it better to live in Russia: regions by salary, housing, health and unemployment
2026-10-24
Where is it better to live in Russia: comparison of regions by salary, housing price, life expectancy and unemployment. Table and charts based on Rosstat data.
-
Population of Voronezh and the Voronezh Region: Rosstat data by year
2026-10-24
The population of Voronezh as of January 1, 2024: 1,046,425 people, 14th place in Russia. Since 2002, the city has grown by 23%, the region is losing residents.
-
Egg Prices in 2026 and Over the Years: How Much a Dozen Costs and Why the Price Fluctuates
2026-10-23
A dozen eggs on 12 October 2026 costs 105.63 ₽, up 17.5% over the year. Egg prices by week, by year since 2000 and by region, Rosstat data.
-
Rural Population of Russia by Year: How Many People Live in Villages and Where They Go
2026-10-23
In rural areas of Russia live 36.3 million people, a quarter of the population. Dynamics since 1990, birth rate and migration, the most rural regions. Rosstat data.
-
Average salary in Saint Petersburg in 2026: how much is paid and how much most people earn
2026-10-23
Average salary in St. Petersburg for January–June 2026 is about 130 thousand ₽, for 2025 123,341 ₽. Median, net, comparison with Moscow and Leningrad region.
-
Unemployment by Russian regions: where it is lowest and highest, data for 2025
2026-10-22
Unemployment by regions of Russia in 2025: from 0.8% in Moscow to 25.5% in Ingushetia. Ranking, dynamics since 2000, districts. Rosstat data.
-
Total Fertility Rate in Russia: by year and by region, data 2026
2026-10-22
Total fertility rate in Russia in 2024: 1.4 children per woman. Dynamics since 2015, urban and rural, mothers’ age, regions, forecast.
-
Minimum subsistence level in Perm Krai in 2026: per adult, child and pensioner
2026-10-22
Subsistence minimum in Perm Krai for 2026: 17,424 ₽ per capita, 18,992 ₽ for workers, 16,901 ₽ per child. Calculation for a family, Rosstat data.
-
Minimum subsistence level in Tatarstan in 2026: for an individual, a child and a pensioner
2026-10-21
Subsistence minimum in Tatarstan for 2026: 16,098 ₽ per capita, 17,547 ₽ for workers, 15,615 ₽ per child. Calculation for a family, Rosstat data.
-
Infant mortality in Russia: how many children die before age one, data 2026
2026-10-21
Infant mortality in Russia in 2025: 3.6 per 1,000 live births. Trend since 2000, boys and girls, regions and districts. Rosstat data.
-
Minimum subsistence level in Bashkortostan in 2026: for an adult, a child and a pensioner
2026-10-21
Subsistence minimum in Bashkortostan for 2026: 16,856 ₽ per capita, 18,373 ₽ for workers, 16,350 ₽ per child. Calculation for a family, Rosstat data.
-
Population of Samara and Samara Oblast: Rosstat data by year
2026-10-16
Population of Samara as of 1 January 2024: 1,158,952 people, tenth place in Russia. In the region 3.11 million. Dynamics by year, Tolyatti, Rosstat data.
-
Population of Yaroslavl and the Yaroslavl Region: Rosstat data by year
2026-10-16
The population of Yaroslavl as of January 1, 2024: 567,443 people, 27th place in Russia. In the region 1.18 million. Dynamics by year, Rybinsk, Rosstat data.
-
Population of Tyumen and Tyumen Oblast: Rosstat data by year
2026-10-16
Population of Tyumen as of 1 January 2024: 861,098 people, 18th place in Russia. Since 2002 the city has grown by 68.5%. Southern part of the oblast and district, Rosstat data.
-
Population of Novosibirsk and Novosibirsk Oblast: Rosstat data by year
2026-10-15
The population of Novosibirsk as of January 1, 2024: 1,633,851 people, the third largest city in Russia. In the region, 2.79 million. Dynamics by year, censuses, Rosstat data.
-
Population of Saint Petersburg in 2026: how many people live in the city according to Rosstat
2026-10-15
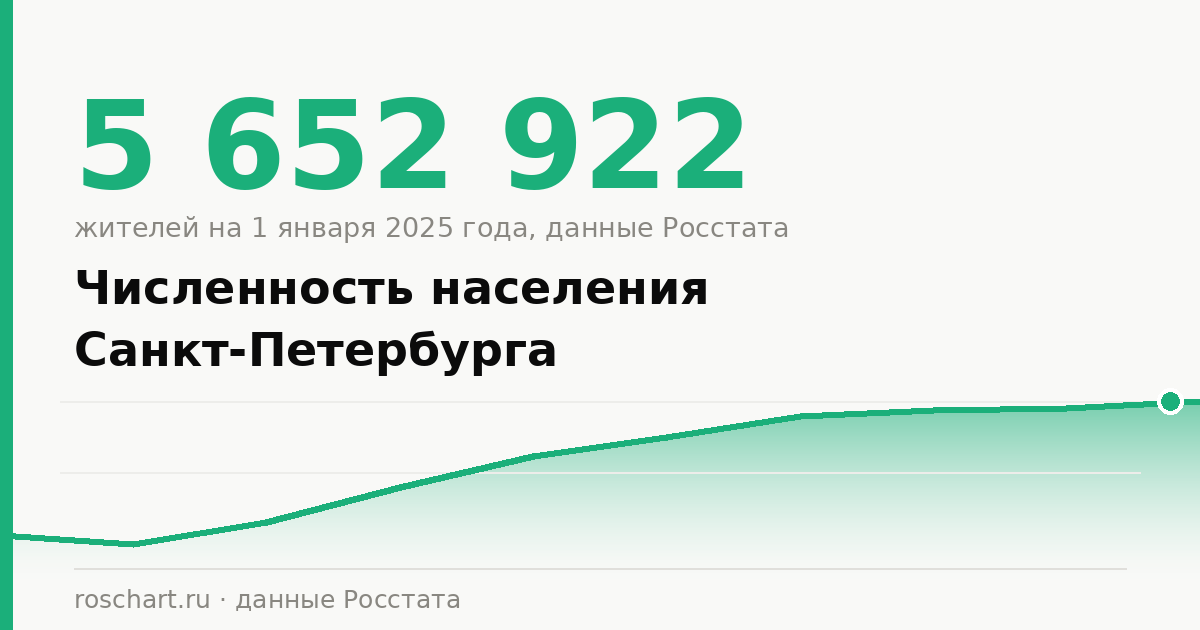
Population of St. Petersburg as of 1 January 2025: 5,652,922 people, for 2024 plus 55,159. Dynamics by years, censuses, Leningrad region. Rosstat data.
-
Subsistence Minimum in Samara Oblast in 2026: per Adult, Child and Pensioner
2026-10-15
Subsistence minimum in Samara Oblast for 2026: 17,803 ₽ per capita, 19,405 ₽ for employed persons, 17,269 ₽ per child. Household calculation, Rosstat data.
-
Population of Kazan and Tatarstan: Rosstat data by year
2026-10-14
Population of Kazan as of 1 January 2024: 1,318,604 people, 5th place in Russia. In Tatarstan 4.02 million, and it is growing. Rosstat data by years.
-
Minimum subsistence level in Chelyabinsk Oblast in 2026: for an adult, a child and a pensioner
2026-10-14
Living wage in Chelyabinsk region for 2026: 17,424 ₽ per capita, 18,992 ₽ for employed, 16,901 ₽ per child. Calculation per family, Rosstat data.
-
Population of Krasnodar and Krasnodar Krai: Rosstat data by year
2026-10-14
Population of Krasnodar as of January 1, 2024: 1,138,654 people, 12th place in Russia. Since 2002 plus 76%. In the region 5.84 million. Rosstat data.
-
Population of Nizhny Novgorod and Nizhny Novgorod Oblast: Rosstat data by year
2026-10-13
Population of Nizhny Novgorod as of 1 January 2024: 1,204,985 people, 7th place among million‑city. In the region 3.04 million. Rosstat data by years.
-
Population of Yekaterinburg and Sverdlovsk Oblast: Rosstat data by year
2026-10-13
Population of Yekaterinburg as of 1 January 2024: 1,536,183 people, 4th place in Russia. In Sverdlovsk Oblast 4.22 million. Rosstat data by year.
-
Subsistence minimum in Nizhny Novgorod region in 2026: per person, child and pensioner
2026-10-13
Subsistence minimum in Nizhny Novgorod Oblast for 2026: 17,803 ₽ per capita, 19,405 ₽ for workers, 17,269 ₽ per child. Calculation per family, Rosstat data.
-
Minimum subsistence level in St. Petersburg in 2026: per adult, child and pensioner
2026-10-12
Subsistence minimum in Saint Petersburg for 2026: 20,644 ₽ per capita, 22,502 ₽ for working people, 20,025 ₽ per child. Calculation per family, Leningrad Region. Rosstat.
-
Minimum subsistence level in Rostov Oblast in 2026: per adult, child and pensioner
2026-10-12
Subsistence minimum in Rostov Oblast for 2026: 17,803 ₽ per capita, 19,405 ₽ for employed persons, 17,269 ₽ per child. Household calculation, Rosstat data.
-
Population of Moscow in 2026: how many people live in the capital according to Rosstat
2026-10-12
Population of Moscow as of January 1, 2025: 13,274,285 people, in 2024 plus 124 thousand. Rosstat data by years, censuses, age and ethnic composition.
-
Housing prices in 2026: how much a square meter costs in Russia and the regions
2026-10-11
Housing prices in 2026: a square meter in a new building is 221,974 ₽, in the secondary market it is 146,470 ₽. Annual growth, regions, apartment classes, how many square meters can be purchased with a salary. Rosstat.
-
Population of Rostov-on-Don and Rostov Oblast: Rosstat data by year
2026-10-11
The population of Rostov-on-Don as of January 1, 2024: 1,140,487 people, 11th place among cities with over a million residents. In the Rostov Region, 4.14 million. Rosstat data by year.
-
Average salary by Russian regions in 2026: tables and charts
2026-10-11
Average salary by region in 2026: 109,100 ₽ across Russia for January–July, ranging from 49 thousand in Ingushetia to 241 thousand in Chukotka. Table and charts of Rosstat.
-
Retail Trade Turnover in 2026: Results for January–August
2026-10-10
Retail trade turnover in 2026: 44.4 trillion rubles for January–August, 10.8% higher than a year ago. What are bought more often, share of chains. Rosstat.
-
Average pension in 2026: how much retirees receive according to Rosstat
2026-10-10
Average pension in 2026: 25,469 rubles in August, 8.3% higher than a year ago. By months, by types, by regions, for men and women. Rosstat data.
-
Minimum subsistence level in Krasnodar Krai for 2026: per adult, child and pensioner
2026-10-10
Subsistence minimum in Krasnodar Krai for 2026: 18,181 ₽ per capita, 19,817 ₽ for employed. Children, pensioners, household calculation, regions. Rosstat.
-
Subsistence Minimum in Sverdlovsk Oblast in 2026: per Adult, Child and Pensioner
2026-10-09
Subsistence minimum in Sverdlovsk Oblast for 2026: 18,750 ₽ per capita, 20,438 ₽ for workers, 18,188 ₽ per child. Calculation per family. Rosstat data.
-
Real household incomes in 2026: growth slowed to 1.2%
2026-10-09
Real incomes of the population in 2026 for the first half-year rose by 1.2% after a +7.7% increase in 2025. Income per person 72,500 rubles, regions. Rosstat.
-
Consumer Price Index in 2026: what it is, how Rosstat calculates it and what is in the basket
2026-10-08
Consumer price index in 2026: 104.67% for January–August. What is in the CPI basket, what weight gasoline and food have, whose inflation is higher. Rosstat data.
-
Subsistence minimum in Moscow and Moscow region in 2026: per adult, child and pensioner
2026-10-08
Living wage in Moscow in 2026: 25,342 ₽ per capita, 28,940 ₽ for workers. Moscow region, pensioners, children, calculation per family. Rosstat data.
-
Population of Russia by region: where the number of people is increasing and where it is decreasing
2026-10-08
Population of Russia by regions as of 1 January 2025: in 2024 the number of residents increased in 22 of the 85 subjects. Births, migrations, results since 2012. Rosstat.
-
Low‑income families in 2026: who lives below the poverty line in Russia
2026-10-07
Low‑income families in 2026: 74% of poor households have children, 29% have three or more. Subsistence minimum 2026, shortage of money in rubles, regions. Rosstat.
-
Inflation by Russian regions in 2026: where prices rise fastest
2026-10-07
Inflation by regions of Russia: in 2025 from 3.68% in Moscow to 9.48% in Kamchatka. July and August 2026, price surge in Crimea, districts. Rosstat data.
-
Population density of Russia: by regions and federal districts
2026-10-07
Population density of Russia: 8.5 people per sq. km. Regions and districts from Moscow (5,134.6) to Chukotka (0.07), where it empties, road density. Rosstat data.
-
Housing delivery in 2026: half-year results for Russia and regions
2026-10-06
Housing delivery in 2026: January–June 42.8 million sq. m, 18% less than a year earlier. Residential construction, developers, regions and districts according to Rosstat.
-
Mortality by regions of Russia: ranking of subjects, causes and charts
2026-10-06
Mortality by regions of Russia: in Pskov Oblast 17 deaths per 1,000 inhabitants, in Ingushetia 3.2. Ranking of subjects, causes of death, Rosstat data.
-
Life expectancy by Russian region: ranking of subjects and charts
2026-10-06
Life expectancy by regions of Russia: in Dagestan 79.9 years, in Moscow 79.4, in Chukotka 66.6. Rating of subjects, federal districts, healthy life. Rosstat.
-
Unemployment rate in Russia in 2026: monthly data and regions
2026-10-05
Unemployment rate in 2026: 2.2% in May–July, 1.68 million unemployed. Monthly dynamics, regions where unemployment increased, Rosstat charts.
-
Purchasing power of income in 2026: how many products can be bought with a salary and a pension
2026-10-05
Purchasing power of income in 2026: per monthly income per capita 311.9 kg of chicken or 99.9 kg of beef. What became cheaper, what did not. Rosstat.
-
How much does a kilowatt-hour of electricity cost in 2026?
2026-10-04
In September 2026, 1 kWh for households costs on average 5.48 ₽. How the price of electricity has risen over the years, when the tariff is indexed and how much it amounts to per month. Rosstat.
-
How much does the minimum food basket cost: price by year and what it includes
2026-10-04
The minimum basket of food per person cost 5,890.6 ₽ per month at the end of 2023, 32% more than in 2020. What it consists of and how it grew. Rosstat.
-
Industrial production in Russia in 2026: results for January–August
2026-10-04
Industrial production in 2026: for January–August 100.0% compared to the previous year. What is rising, what is falling, which regions are ahead. Rosstat charts.
-
Average salary used for calculating alimony in 2026: how much per child
2026-10-03
Average salary for calculating alimony in 2026: 114,742.7 ₽ for June according to Rosstat. How much it amounts to for one, two and three children, debt examples.
-
Life expectancy of men and women in Russia: a gap of 10.7 years and the forecast for 2026
2026-10-03
Life expectancy of men in Russia 68 years, women 78.7 years according to Rosstat. Why the gap is almost 11 years, forecast for 2026, regions. Charts.
-
Average salary of a teacher and a doctor in Russia: how much they actually get paid
2026-10-03
A schoolteacher receives an average of 71,444 ₽, a doctor 121,322 ₽ (January-June 2024, Rosstat). Salaries by region and by year, comparison with nurses.
-
Food Prices in 2026: What Went Up and What Went Down Over the Year
2026-10-02
Food prices in 2026 according to Rosstat: potatoes +32% year-on-year, beef 756 ₽ per kg, butter is getting cheaper. Weekly basket +6.7%.
-
Russia Demography: Key Figures on Population, Births and Deaths
2026-10-02
Demography of Russia according to Rosstat: population 146.1 million, fertility 1.4 children per woman, life expectancy 73.4 years, decline 599 thousand in 2024. Charts.
-
Gasoline Prices in 2026: How Much a Liter of AI-92, AI-95 and Diesel Costs
2026-10-02
Gasoline prices in 2026 according to Rosstat: AI‑92 74.59 ₽, AI‑95 80.79 ₽, diesel 87.37 ₽ per litre. Over the year +24%, with inflation 6.34%. Full tank and charts.
-
Average salary in Moscow in 2026: how much is paid and how much the majority receives
2026-10-01
Average salary in Moscow for January–June 2026 is about 196.6 thousand ₽, for 2025 181,777 ₽. Median, net, comparison with the Moscow region and the country.
-
How many subjects in the Russian Federation in 2026 and how they differ: population, area, salary
2026-10-01
Subjects of the Russian Federation in 2026: there are 89. How many republics, krais and oblasts, the largest and smallest by population and area, where wages are higher. Rosstat data.
-
In‑demand professions in Russia in 2026: where workers are lacking
2026-10-01
In-demand occupations according to Rosstat data: 2.23 million vacancies, the most needed are workers, drivers, builders and doctors. Where people are lacking.
-
GRP of Russian regions: who has a larger economy and why it should be per capita
2026-09-30
GRP of Russian regions in 2024: 186.5 trillion rubles, of which 41 trillion belong to Moscow. The ten largest economies, growth by regions and why per capita is fairer. Rosstat.
-
Peoples of Russia: National composition of the population according to the 2020 Census
2026-09-30
National composition of Russia according to the 2020 census: Russians 105.6 million, Tatars 4.7 million, Chechens 1.7 million. How many peoples, who are growing, which languages. Rosstat.
-
2020 Population Census: Key Results in Numbers
2026-09-30
Results of the 2020 population census: 147.2 million people, three quarters in cities, 42% of households consist of one person. Age, education, housing. Rosstat.
-
Inflation in 2026: how much it was and what rose the most
2026-09-29
Inflation in 2026: 4.67% from January to August, 6.34% over 12 months. Gasoline +19.9%, services +7.3%, food +2.8%. Rosstat data and charts.
-
Russia's largest cities by population: list and charts
2026-09-29
Russian cities by population as of January 1, 2024: 16 cities with over a million residents, Moscow has 13.15 million. Who is growing, who is losing residents. Rosstat data.
-
Minimum subsistence level per child in 2026: how much across Russia and in the regions
2026-09-29
Subsistence minimum per child in 2026: 18,371 ₽ across Russia, 21,903 ₽ in Moscow. How the unified benefit and alimony are calculated from it, all regions, Rosstat.
-
Average Salary in Russia in 2026: How Much Is Paid and How Much It Has Grown
2026-09-28
Average salary in 2026: 109,029 ₽ for January–June, in June 114,743 ₽. Growth compared to 2025, net amount, regions and industries according to Rosstat.
-
Minimum subsistence level for pensioners in 2026: figures for Russia and its regions
2026-09-28
Pensioner's subsistence minimum in 2026: 16,288 ₽ across Russia, 18,971 ₽ in Moscow. Who is entitled to a social pension supplement, all regions, Rosstat data.
-
Population of Russia: how many people live in the country on 1 January 2025
2026-09-28
Population of Russia as of 1 January 2025: 146,119,928 people. Rosstat forecast for early 2026, largest regions, world ranking.
-
Subsistence minimum in 2026 by region: how much in Moscow, the Moscow region and other subjects
2026-09-27
Subsistence minimum for 2026: 18,939 ₽ per person across Russia, 25,342 ₽ in Moscow, 20,286 ₽ in the Moscow region. All regions, pensioners, children, Rosstat data.
-
Russia's GDP per capita: how much in rubles, in dollars, and by PPP
2026-09-27
Russia's GDP per capita in 2024: 1,384,473 rubles, 47,686 dollars at PPP, and about 15 thousand at the exchange rate. Why the figures differ, regions, Rosstat data.
-
Gini coefficient in Russia: income inequality, decile ratio and regions
2026-09-27
Gini coefficient in Russia in 2025 is 0.422, fund coefficient 16 times, decile 7.5. Incomes of ten population groups and regions according to Rosstat data.
-
How many schoolchildren and teachers are there in Russia: statistics by year
2026-09-26
18.0 million schoolchildren and 1,069 thousand teachers in the 2024/25 academic year. There are 16.8 students per teacher compared to 15.3 five years ago. Second shift, classes, schedules.
-
Outbound tourism: where Russians travel and how many trips per year
2026-09-26
29.8 million outbound tourist trips in 2025 compared to 45.3 million in 2019. Turkey 6.4 million, Abkhazia 5.6 million, UAE 2.3 million. Table by country and year, charts.
-
Median salary in Russia: what it is and how much half of workers earn
2026-09-26
Median salary in Russia 73,871 ₽ (April 2025): half of employees earn less. How the median differs from the average, regions, industries, charts.
-
Russia's Export and Import by Year: Statistics and Charts
2026-09-25
Export of goods in 2024 was 433.9 billion dollars, import 283.0 billion. How supplies have changed since 2000, the structure of exports and the shift from Europe to Asia.
-
Emergency housing in Russia: how much there is and where it is most prevalent
2026-09-24
By the end of 2024 the emergency housing stock was 23.8 million sq. m compared with 15.2 million in 2015. In emergency houses live 0.51% of city dwellers, in Yakutia 8.4%. Table, regions, charts.
-
Forest Fires in Russia by Year: Area, Regions and Charts
2026-09-23
In 2024, fire affected 6.98 million ha of forest land, in 2019 it was 8.64 million, in 2013 it was 1.07 million. Table by years, leading regions, number of fires and charts.
-
How many museums, theaters, and libraries are there in Russia: statistics by year
2026-09-22
3,216 museums and 142.4 million visits, 728 theaters and 42.8 million spectators, 40.7 thousand libraries. Russian cultural statistics by year with tables and charts.
-
Food Consumption in Russia by Year: Statistics and Charts
2026-09-21
Meat in 2024 was 82 kg per person versus 75 in 1990, milk 253 versus 387, potatoes 84 versus 106. Table by years, gap between poor and rich.
-
Road construction in Russia by year: full statistics and graphs
2026-09-20
In 2024, 2,194 km of paved roads were commissioned, compared to 7,924 km in 2000. Network density increased from 39 to 66 km per 1,000 sq. km. Table, regions, charts.
-
What Russians spend money on: expense structure by income groups
2026-09-19
The poorest 10% of households spend 48.9% of their budget on food, the richest 18.9%. Transport is the opposite: 7.1% versus 29.4%. Structure of consumer expenditures by deciles, charts.
-
How Much Waste is Generated in Russia: Statistics by Year and Industry
2026-09-18
In 2025, 7.84 billion tons of waste were generated in Russia, 1.88 billion were recovered. The recycling rate fell from 59.6% to 24%. Table by year and industry, charts.
-
Oil and Gas Production in Russia by Year: Complete Statistics and Charts
2026-09-17
Oil production in Russia 535 million tons for 2022, gas 638 billion cubic meters for 2023. Share in world production, comparison with the USA and Saudi Arabia, charts.
-
Atmospheric emissions in Russia by year: complete statistics and charts
2026-09-16
In 2025, 21.2 million tons of pollutants were emitted into the atmosphere, of which 16.6 million came from factories and boiler houses. Time series from 2000, methodological break in 2019, charts.
-
Average Salary by Industry in Russia: Full Statistics and Charts
2026-09-15
Finance 205,974 ₽, IT 166,037 ₽, catering 53,568 ₽ with a national average of 89,069 ₽ for 2024. Table by all industries, growth rates, charts, Rosstat.
-
Population of Russia by year: full statistics and charts
2026-09-14
As of 1 January 2025, Russia had 146,119,928 people. The peak was in 2020: 147.96 million. Table by years, leading regions, charts, Rosstat data.
-
Alcoholism in Russia by year: full statistics and charts
2026-09-13
In 2025, 56.9 new cases of alcoholism were identified per 100 thousand people, compared with 107.8 in 2010. Drug addiction fell by half. Variation across regions, charts, Rosstat data.
-
How many officials are there in Russia: statistics by year and region
2026-09-12
For every 10,000 residents of Russia, there are 153 civil servants. Trend since 2000, regional spread from 83 to 622 people. Rosstat data and charts.
-
Grain Harvest in Russia by Year: Complete Statistics and Charts
2026-09-11
In 2023, Russia harvested 145.0 million tonnes of grain; the record of 157.6 million tonnes was in 2022. Yields by region, comparison with countries of the world. Rosstat data.
-
How many tractors and combine harvesters are in Russia: statistics by year
2026-09-10
In 2025, Russian agricultural organisations had 194.2 thousand tractors compared with 1,365.6 thousand in 1990. Combine harvesters, seeders, ploughing load. Rosstat data, tables and graphs.
-
Electricity consumption in Russia by year: statistics and charts
2026-09-09
In 2025 Russia consumed 1,195 billion kWh of electricity. Dynamics since 2005, leaders among regions, breakdown by federal districts. Rosstat data and charts.
-
Morbidity in Russia by Year: Full Statistics and Charts
2026-09-08
In 2024, Russia registered 120.0 million diseases with a newly established diagnosis, 821 cases per 1,000 people. Dynamics by disease classes, charts, Rosstat data.
-
Average Salary by Regions of Russia: Full Statistics and Charts
2026-09-07
Average salary in Russia for 2025 was 101,784 rubles. The gap between regions is almost fivefold: 217 thousand in Chukotka and 44 thousand in Ingushetia. Data from Rosstat and charts.
-
Domestic tourism in Russia: how many people travel and where they stay
2026-09-06
In 2024, 90 million people were accommodated in hotels and sanatoriums, compared with 47 million in 2020. Data by year, hotels and sanatoriums, children, foreigners. Rosstat.
-
How many pensioners are there in Russia: statistics by year
2026-09-05
As of January 1, 2026, there are 40.5 million pensioners in Russia, compared to 46.5 million in 2019. By type of pension, working pensioners, men and women. Rosstat data.
-
Real incomes of the Russian population by year: full statistics
2026-09-04
Real monetary incomes fell for seven consecutive years since 2014 and increased by 36% over 2021–2025. Table by years, breakdown by districts. Rosstat data.
-
Utility tariffs in Russia by year: how much water, heat, gas and electricity cost
2026-09-03
Heating prices rose from 1,649 to 2,653 rubles per Gcal, water disposal increased by 83% over nine years. Utility tariffs by year, all types of services. Rosstat data.
-
Housing prices in Russia by year: table, charts and gap between markets
2026-09-02
In 2024, a square meter in a new building cost 177.9 thousand rubles, on the secondary market 114.1 thousand. Table by years, gap between markets, prices by regions. Rosstat data.
-
Mortality in Russia by Year: Statistics, Causes and Charts
2026-09-01
In 2023, 1.76 million people died in Russia, compared with a peak of 2.44 million in 2021. Table by year, causes of death, rate per 1,000 people. Rosstat data.
-
Birth rate in Russia by year: statistics, charts and reasons for the decline
2026-08-31
In 2022, Russia had 1,304,087 births compared with 1,940,579 in the peak 2015. Table by years, total coefficient, mothers’ age. Rosstat data.
-
How many children attend kindergarten in Russia: statistics by year
2026-08-30
At the end of 2025, there were 6.09 million children enrolled in kindergartens, compared to a peak of 7.61 million in 2019. Spaces, waiting lists, private kindergartens, urban and rural areas. Rosstat data, charts.
-
Road traffic accidents in Russia by year: statistics on crashes, fatalities, and injuries
2026-08-29
In 2025, 128,793 road traffic accidents and 159,889 injured, compared with 184,000 and 231,197 in 2015. Fatalities per 100,000 population, accidents caused by drunk drivers, Rosstat data.
-
Passenger transport in Russia by year: statistics and charts
2026-08-28
Public transport carried 15.7 billion passengers in 2024 compared with 44.8 billion in 2000. Passenger turnover rose to 599.5 billion passenger‑km. Rosstat data.
-
Prices of food products in Russia by year: complete statistics
2026-08-27
Rosstat average prices since 1991: butter 1175 rubles/kg, beef 676, milk 98. What has become more expensive the most over the past ten years and what has become cheaper. Graphs by year.
-
Marriages and divorces in Russia by year: statistics and charts
2026-08-26
In 2023, there were 946 thousand marriages and 684 thousand divorces: 723 divorces per 1,000 marriages. Rosstat data since 1960, age of the groom and bride, months, regions.
-
How many students are there in Russia: statistics by year
2026-08-25
In Russian universities there are 4.43 million students, in colleges 3.27 million. Rosstat data since 2000: admissions, graduations, paid education, forms of study, yearly charts.
-
Crime in Russia by Year: Full Statistics and Charts
2026-08-24
Registered 1.91 million crimes in 2024 against 2.02 million in 2019. Thefts fell by a third, fraud increased by 73%. Rosstat data and charts.
-
How many children in Russia are involved in sports: statistics by year
2026-08-23
Children aged 3–15 regularly engaged in sports: 21.0 million in 2025 vs. 10.6 million in 2010. Rosstat data by region, tables and graphs by year.
-
Inbound tourism in Russia by year: how many foreigners arrive
2026-08-22
Inbound tourism in Russia: 7.9 million trips by foreigners in 2025 versus 24.4 million in 2019. Rosstat statistics by countries, tables and charts by years.
-
Employment level in Russia by year: statistics since 2000 and charts
2026-08-21
Employment rate of the population aged 15‑72 in Russia: 67.7% in 2025 versus 58.5% in 2000. Employed 74.3 million people. Rosstat data by region and charts.
-
How many restaurants, cafés and bars are there in Russia: statistics by year
2026-08-20
Number of restaurants, cafes and bars in Russia: 107,918 establishments at the end of 2025 versus 63,505 in 2011. Turnover of the catering sector by regions, Rosstat data and charts.
-
How many Russians use the internet: statistics by year and region
2026-08-19
Internet in Russia by year: 96 users per 100 people and 91.9% of households with access in 2025. Rosstat statistics by region, tables and graphs.
-
Salary and Education Level in Russia: How Much a Degree Actually Gives
2026-08-18
Salary by education level in Russia: 123,183 rub. with higher education versus 79,237 with secondary professional in 2025. Rosstat data by years and charts.
-
Age structure of the Russian population: how many people are at each age
2026-08-17
Age composition of the population of Russia by year: 27.2 million younger than working age, 83.4 million of working age, 35.8 million older. Rosstat data since 1959.
-
Livestock population in Russia by year: statistics since 1990 and charts
2026-08-16
Livestock population in Russia by year: 15.7 million heads of cattle and 7.0 million cows in 2025 compared to 57.0 and 20.6 million in 1990. Rosstat data, tables, and charts.
-
How many square meters of housing per person in Russia
2026-08-15
Housing provision in Russia: 29.4 sq. m per person in 2024. Rosstat data by year, urban and rural areas, number of apartments and their average size.
-
Number of doctors in Russia by year: statistics since 1970 and charts
2026-08-14
How many doctors in Russia: 749.9 thousand in 2024, 51.3 per 10 thousand population. Rosstat data by years and specialties, number of hospital beds, charts.
-
How many men and women are there in Russia: figures by age and charts
2026-08-13
How many men and women are there in Russia: 67.9 million versus 78.2 million in 2024. Rosstat data by age, urban and rural areas, and the ratio by year since 1959.
-
Life expectancy in Russia by year: statistics and charts
2026-08-12
Life expectancy in Russia by year: 73.41 years in 2023. Rosstat data for all regions, tables, the gap between constituent entities, and charts.
-
Russia’s GDP by year: statistics from 1995 and charts
2026-08-11
Russia’s GDP by year from 1995 to 2025: 7.24 trillion dollars at purchasing power parity. Rosstat data, tables, growth rates, charts.
-
Housing input in Russia by year: statistics since 1990 and charts
2026-08-10
Housing commissioning in Russia by year from 1990 to 2025: 108.1 million m² for 2025. Rosstat data, table by year, breakdown by regions, charts.
-
Investment in fixed capital by Russian regions: statistics and charts
2026-08-09
Investment in fixed capital in Russia by year and region: 42.6 trillion rubles in 2025. Rosstat data, tables by constituent entities, charts, analysis.
-
International migration in Russia: statistics by year and country
2026-08-08
International migration in Russia by year: how many people arrived and departed from 1997 to 2023. Rosstat data, tables, breakdown by country, charts.
-
Paid services to the population in Russia: where 20 trillion rubles go
2026-08-07
Structure of paid services to the population in Russia: 20.05 trillion rubles in 2025, Rosstat data. Where the money goes, shares by service types, charts and tables.
-
Retail trade turnover in Russia by year: statistics and charts
2026-08-06
Retail trade turnover in Russia by year from 2000 to 2025: Rosstat data, table and charts. In 2025, 62.3 trillion rubles, regional disparity of 5 times.
-
Average pension in Russia by year: statistics and charts
2026-08-05
Average pension in Russia by year from 2017 to 2026: Rosstat data in a table and charts. As of 1 January 2026, 25,254 rubles, for old-age pensions 27,203 rubles.
-
Poverty level in Russia by year: statistics since 1995 and charts
2026-08-04
Poverty rate in Russia by year from 1995 to 2025: Rosstat data in a table and charts. In 2025, 6.7%, or 9.7 million people, the lowest in history.
-
Unemployment rate in Russia by year: statistics from 2000 and charts
2026-08-03
Unemployment rate in Russia by year from 2000 to 2025: Rosstat data, table and charts. In 2025, 2.2%, the gap between regions is 32 times.
-
Average salary in Russia by year: statistics since 2000 and charts
2026-07-29
Average salary in Russia by year from 2000 to 2025: Rosstat data in a table and on charts. In 2025, 100,186 rubles per month, the gap between regions is 4.8 times.
-
Inflation in Russia by year: complete statistics since 1991 and charts
2026-07-28
Inflation in Russia by year from 1991 to 2026: official Rosstat data in a table and interactive charts. 2025: 5.6%, first half of 2026: 4.2%.