
Traffic Accidents by Russian Regions: Where It Is More Dangerous to Drive, Rosstat Data
· National set of SDG indicators
If you drive on Russian roads, the risk of dying in an accident depends on the region more than it seems. In 2024, Kalmykia had 36.7 fatalities per 100,000 residents, Tuva 28.4, Moscow 2.6, and Saint Petersburg also 2.6. The difference between the top of the list and the middle is more than tenfold, while across the country overall it is 9.9 people per 100,000. Below is a ranking of regions, a breakdown by federal districts, the number of accidents in major cities, and the role of drunk drivers. Each section has a chart, and the full set for all 86 subjects is available on the website.
Where the most people die: regional ranking for 2024
Rosstat calculates traffic accident mortality per 100,000 residents of a region. The indicator is tied to inhabitants, not to vehicles or road kilometres, so it includes both transit routes and empty areas. But for comparing regions with each other it is the most convenient.
Top ten in descending order, 2024, deaths per 100,000 residents:
| Place | Region | 2024 | 2018 |
|---|---|---|---|
| 1 | Republic of Kalmykia | 36.7 | 30.4 |
| 2 | Republic of Tuva | 28.4 | 28.4 |
| 3 | Republic of Altai | 20.9 | 16.4 |
| 4 | Zabaykalsky Krai | 20.3 | 23.0 |
| 5 | Pskov Oblast | 17.3 | 19.4 |
| 6 | Magadan Oblast | 17.2 | 21.2 |
| 7 | Ryazan Oblast | 16.9 | 19.7 |
| 8 | Amur Oblast | 16.5 | 17.1 |
| 9 | Voronezh Oblast | 16.1 | 19.0 |
| 10 | Republic of Adygea | 16.0 | 22.4 |
At the opposite end of the list are Chukotka (2.1), Nenets Autonomous Okrug (2.4), Moscow (2.6), Saint Petersburg (2.6) and Chechnya (2.8). Next come Sevastopol (4.1), Tomsk Oblast (6.3), Yamalo-Nenets Autonomous Okrug and Murmansk Oblast (both 6.4) and Yugra (6.7).
Kalmykia stands apart even among the leaders: in 2023 the figure jumped to 46.5, and in 2024 fell to 36.7, still almost four times the Russian average. Moscow is 14 times safer by this measure.
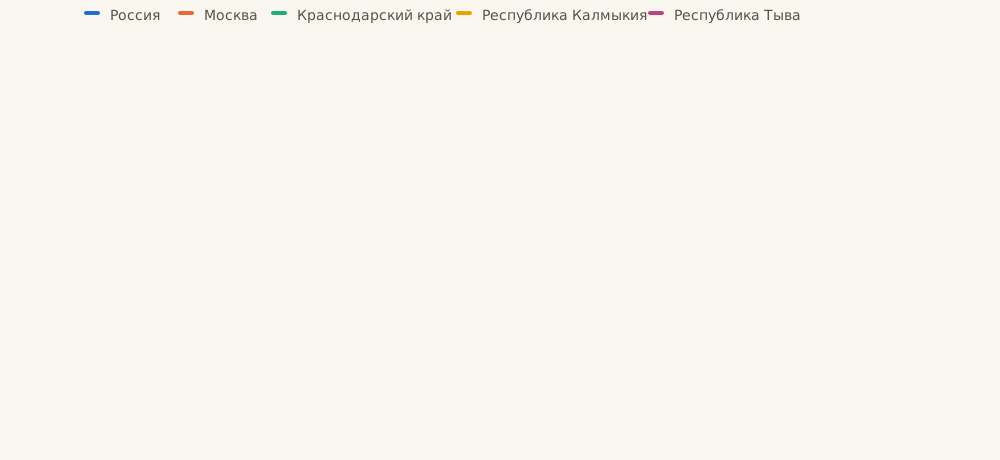
Tuva stays at the level of 28 people per 100,000 for all seven years, with a peak of 33.4 in 2021. Krasnodar Krai, popular with vacationers, showed 13.5 in 2024, which is above the national average (9.9), although it has declined from 18.6 since 2018.
See how the picture has changed for your region in the dataset on traffic accident deaths: it contains all 86 subjects since 2018.
Federal districts: the Far East and the South are more dangerous than the North and the Center
Looking at a larger scale, at the district level, the picture is consistent. In 2024 per 100 thousand residents:
- Far Eastern district: 13.5;
- Southern: 12.3;
- Siberian: 10.6;
- Volga: 10.3;
- North Caucasus: 10.1;
- Ural: 9.0;
- Central: 8.4;
- Northwestern: 7.8.
Average for Russia 9.9. The gap between the Far East and the Northwestern district is almost twice.
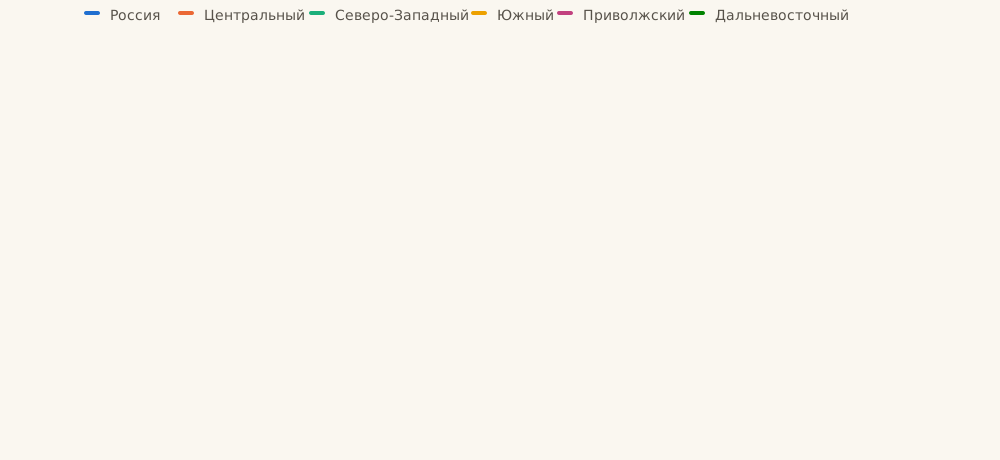
The Far East and the South were the worst in 2018 (16.0 and 15.3), but since then the South improved more noticeably: 12.3 versus 15.3. The Far East fell only to 13.5. The indicator for the whole country over the same years dropped from 12.4 to 9.9, that is by 20.6%.
However, 2023 turned out to be unfavorable for several districts. The Southern rose from 11.3 to 12.6, the Ural from 8.5 to 9.6, the Central from 8.0 to 8.2. If you plan a trip to the south, note: improvement has stopped there.
What has changed since 2018: who improved and who worsened
The regions that dealt with the six‑year period best were those that were very dangerous in 2018:
- Leningrad region: from 23.7 to 15.1;
- Tula region: from 19.3 to 11.1;
- Novgorod region: from 18.7 to 11.4;
- Kaluga region: from 18.9 to 11.8;
- Mordovia: from 18.6 to 11.7.
Moscow oblast also shows a noticeable shift: from 12.3 to 7.5 per 100 thousand.
The worst developments were in Kalmykia (from 30.4 to 36.7), the Altai Republic (from 16.4 to 20.9), Karelia (from 12.1 to 15.5), Kostroma (from 10.0 to 12.1), Ivanovo (from 8.1 to 10.1) and Belgorod (from 10.0 to 11.9) regions.
Regional indicators in sparsely populated subjects jump from year to year: Chukotka had 12.1 in 2020 and 2.1 in 2024, because with a population of only a few tens of thousands one accident changes the figure dramatically. Therefore, one should look at the average level over several years, not at a single year.
How many accidents in major regions
Mortality per capita shows risk, and the absolute number of road accidents shows scale. In 2025, by number of accidents the leaders were:
| Region | Accidents in 2025 | Accidents in 2015 | Injured in 2025 |
|---|---|---|---|
| Moscow | 8 166 | 10 396 | 9 102 |
| Krasnodar Krai | 5 992 | 6 282 | 7 104 |
| Nizhny Novgorod Oblast | 4 574 | 5 342 | 5 785 |
| Saint Petersburg | 3 835 | 7 243 | 4 180 |
| Moscow Oblast | 3 756 | 7 884 | 4 057 |
| Chelyabinsk Oblast | 3 640 | 4 579 | 4 434 |
Overall across the country 128 793 accidents in 2025 and 159 889 injured. Moscow accounts for 6.3% of all accidents, Krasnodar Krai 4.7%.
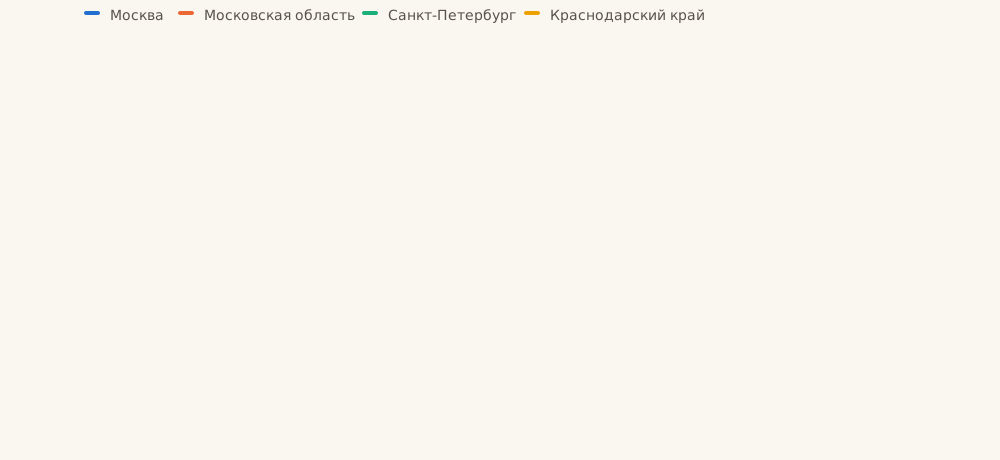
Note the Moscow Oblast and Saint Petersburg: the number of accidents fell almost in half (by 52% and 47%), and in Krasnodar Krai only by 4.6%. Rosstat notes in a footnote that since 2020 the indicator is calculated according to a new government decree (No. 1502 of 19 September 2020). How exactly the accounting changed was not included in the set, so comparing 2015 and 2025 by regions should be done cautiously. It is more reliable to compare years after 2020.
More about overall statistics for the country and dynamics since 2015: Road accidents in Russia by year.
Drunk drivers: which regions have more accidents
A separate Rosstat dataset counts accidents where the driver was intoxicated. Across the country in 2025 there were 10,197 of them, with 3,081 deaths. That is about eight percent of all road accidents, but the number of deaths per 100 accidents in this category is noticeably higher than the average.
Most deaths in 2025:
- Krasnodar Krai: 145 (in 2015 it was 138);
- Irkutsk Oblast: 107;
- Zabaykalsky Krai: 104;
- Krasnoyarsk Krai: 101 (in 2015 it was 164);
- Moscow Oblast: 99 (in 2015 it was 124).
By the number of accidents caused by intoxication, the first is also Kuban (424, was 580), followed by Nizhny Novgorod Oblast (327) and Irkutsk (310). In Moscow there were 158 such accidents (was 355), with 25 deaths. In St. Petersburg there were 105 accidents and 20 deaths.
The picture varies: Moscow and Krasnoyarsk Krai have noticeably reduced the number of such accidents and deaths, while Zabaykalsky and Bashkiria, where there were 71 and 57 deaths in 2015, now have 104 and 96. If your route goes through Siberia or Zabaykalsky, the evening and night segments of the journey are more dangerous than you are used to in a large city. This is a conclusion drawn from the data, not a separate Rosstat assessment.
Frequently Asked Questions
Which region of Russia has the highest traffic accident mortality? In Kalmykia: 36.7 deaths per 100 thousand residents in 2024. In second place Tyva (28.4), in third Altai Republic (20.9).
Which region has the lowest? Chukotka (2.1), Nenets Autonomous Okrug (2.4), Moscow and Saint Petersburg (2.6 each). But Chukotka and the Nenets Autonomous Okrug have small populations, and the indicator fluctuates sharply from year to year.
Why are there so few deaths in Moscow despite having the most accidents? Rosstat data show only the result: Moscow has 2.6 deaths per 100 thousand residents with 8,166 accidents, while Kalmykia has 557 accidents and an indicator of 36.7. There is no set of reasons. One can assume that accidents in the city occur at low speed, while on rural highways with sparse population they are more severe, but this is a guess, not a conclusion drawn from the table.
Has it become safer to drive in recent years? Overall, yes: across the country mortality fell from 12.4 in 2018 to 9.9 in 2024. However, after 2022 the improvement slowed, and in the Southern and Far Eastern districts it stalled.
Where can I view data for my region? In the traffic accident mortality dataset select your region in the chart legend. All subjects are listed in the table below the chart.
In Brief
- In 2024 the most dangerous regions are Kalmykia (36.7 per 100 thousand) and Tyva (28.4); the least dangerous are Chukotka (2.1), Nenets Autonomous Okrug (2.4), Moscow and Saint Petersburg (2.6 each).
- By district, the Far East (13.5) and the South (12.3) are the most hazardous, while the Northwest (7.8) and the Center (8.4) are the safest.
- Since 2018, the fastest improvements have been in Leningrad and Tula regions, while Kalmykia and Altai Republic have worsened.
- The highest number of accidents is in Moscow (8,166 in 2025); the most deaths caused by drunk drivers occurred in Krasnodar Krai (145).
- The data are taken from the national Sustainable Development Goals indicators set and Rosstat's statistical yearbook.
Data source: Rosstat, indicators "Number of deaths in road traffic accidents", "Number of traffic accidents", "Number of persons injured in traffic accidents" and "Number of traffic accidents and deaths caused by intoxicated drivers".